1
2
3
4
5
6
7
8
9
10
11
12
13
14
15
16
17
18
19
20
21
22
23
24
25
26
27
28
29
30
31
32
33
34
35
36
37
38
39
40
41
42
43
44
45
46
47
48
49
50
51
52
53
54
55
56
57
58
59
60
61
62
63
|
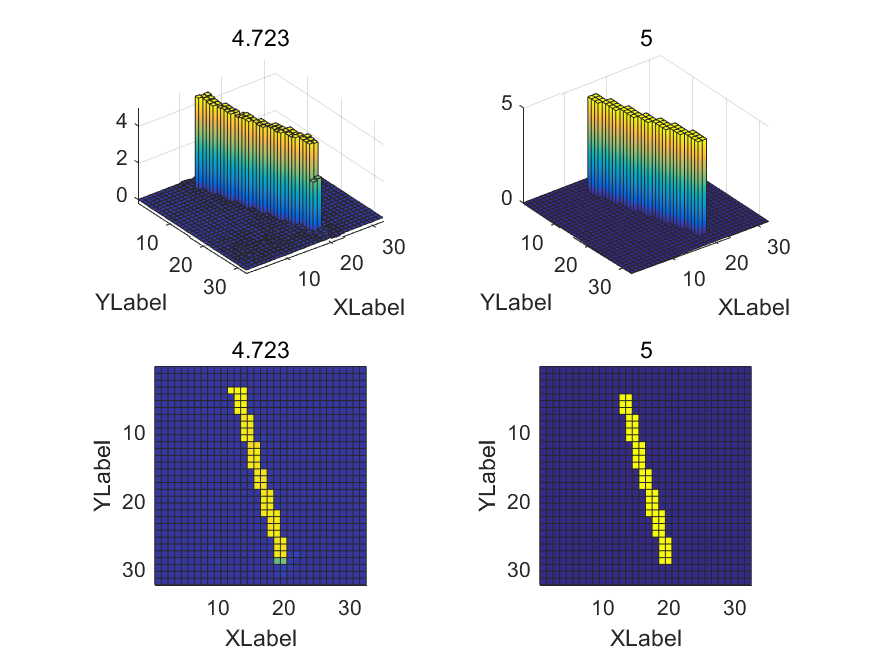
gcf=figure;
subplot(221)
b = bar3(roundn(6*reshape(fake_imgs(n_shape,3,:,:),32,32),-2),1);
hXLabel = xlabel('XLabel');
hYLabel = ylabel('YLabel');
xlim([0 32])
ylim([0 32])
zlim([0 5])
for k = 1:length(b)
    zdata = b(k).ZData;
    b(k).CData = zdata;
    b(k).FaceColor = 'interp';
end
title(num2str(6*fake_imgs(n_shape,3,16,16)))
axis tight

subplot(222)
b = bar3(6*reshape(FT_Signal(3,:,:),32,32),1);
hXLabel = xlabel('XLabel');
hYLabel = ylabel('YLabel');
xlim([0 32])
ylim([0 32])
zlim([0 5])
for k = 1:length(b)
    zdata = b(k).ZData;
    b(k).CData = zdata;
    b(k).FaceColor = 'interp';
end
title(num2str(6*FT_Signal(3,16,16)))
axis tight

subplot(223)
b = bar3(roundn(6*reshape(fake_imgs(n_shape,3,:,:),32,32),-2),1);
hXLabel = xlabel('XLabel');
hYLabel = ylabel('YLabel');
xlim([0 32])
ylim([0 32])
zlim([0 5])
view(0,90)
for k = 1:length(b)
    zdata = b(k).ZData;
    b(k).CData = zdata;
    b(k).FaceColor = 'interp';
end
title(num2str(6*fake_imgs(n_shape,3,16,16)))
axis tight

subplot(224)
b = bar3(6*reshape(FT_Signal(3,:,:),32,32),1);
hXLabel = xlabel('XLabel');
hYLabel = ylabel('YLabel');
xlim([0 32])
ylim([0 32])
zlim([0 5])
view(0,90)
for k = 1:length(b)
    zdata = b(k).ZData;
    b(k).CData = zdata;
    b(k).FaceColor = 'interp';
end
title(num2str(6*FT_Signal(3,16,16)))
axis tight
|